WS LOGIN
On the Face of it a 0.3% drop in constuction output for the fourth quater does not look great. However there are a couple of factors to mention, q3 was extremely strong, which surprised many, showing 2.1% growth. Also December numbers dropped hugely, weighting down the whole quarter, it was 2.8% lower than November. Private housebuilding was almost 7% below November.
Looking more closely at the data though it is clear that this can be looked at as a slowdown from the pretty high numbers we hit in q3. All categories, are higher than this time last year, Private Housebuilding up 2%, Infrastructure up 15%, Other work 3% and repair and maintaince is up 1.7%. The extent of the slowing is not huge when seem against the growth in the last few years, particularly private house building where output is now more than double 2013!
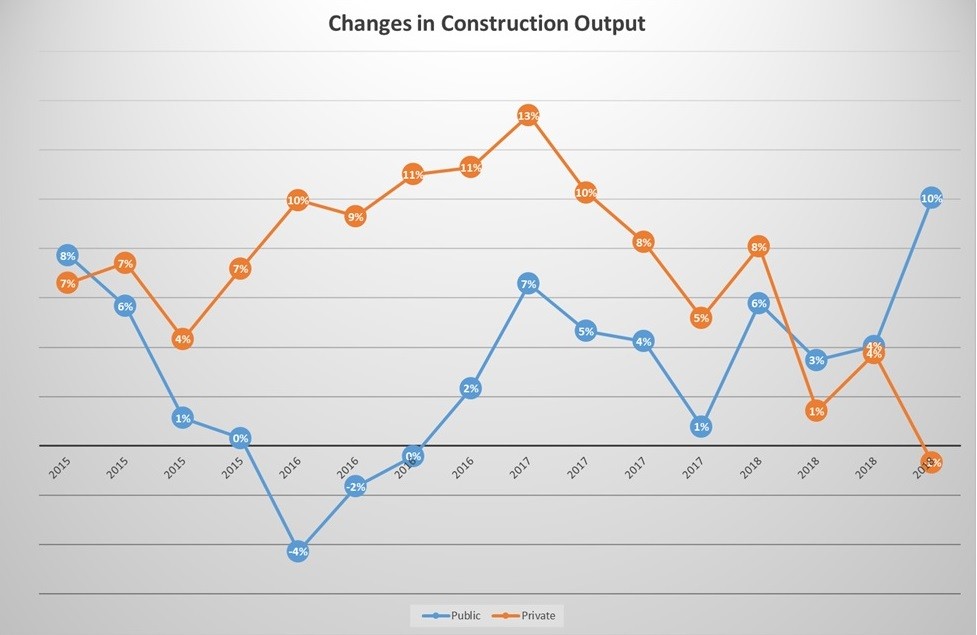
Another trend to draw attention to is the fact that public spending in construction is now growing far quicker than the private sector. The blue line in the chart is public sector output, the orange line is private sector. In fact private sector work across all categories actually dropped in q418 against last year, whereas public work was up 10%. It seems that this increase in public spending is offsetting slightly worrying trends in the private sector. The graph shows this pretty clearly.
It is hard to avoid the B word when talking about this and we have certainly seen a slight slowdown in certain areas in our business. How many people want to take on alot of debt in order to buy a house when uncertainty is so high? The media coverage certainly isn't helping. Along with everyone else in business I think there is alot of pent up demand out there which will produce a strong construction market as soon as we know where we will be in 2 years!
